Inspecting coredumps like it's 2021
By Maximilian Bosch | Mon, 06 Sep 2021
A coredump is a snapshot of a process’s memory that is usually created by the kernel when a crash happens. These can be fairly helpful to find out which part of the code broke by looking at the backtrace or finding any kind of corruption by introspecting the memory itself. Unfortunately it can be a bit tedious to work with these. This article aims to give an overview over helpful tools & tricks to leverage the full power of coredumps on Nix-based systems.
coredumpctl(1)
On traditional Linux-systems the kernel has to be configured manually in order to take care of coredumps. This is not only an additional maintenance burden, but also lacks a proper integration with other components such as the logging facility.
Instead it’s usually a better option on systemd-based systems to use their small utility
coredumpctl(1). On
NixOS, which has a fairly strong integration with systemd, it’s enabled by default. On e.g.
Ubuntu it can be obtained by installing the
systemd-coredump-package:
$ sudo apt-get install -y systemd-coredump
To demonstrate what happens with this package installed, the behavior of systemd is shown
after executing the following C program which results in an (intentional) segfault:
1int main() {
2    int *ptr = (int*) 0;
3    *ptr = 1;
4}
-
The Linux kernel generates a corefile.
-
systemd-coredump(8)acquires this file and places it into/var/lib/systemd/coredump. -
A message is written to the
journal. This may look as follows:Jul 19 00:26:24 host systemd-coredump[3327044]: Process 3327042 (a.out) of user 1000 dumped core. -
Since the
journalhas a custom binary format, it can save additional properties which can be viewed via e.g.journalctl -o json. A log entry which represents a coredump (such as the one shown above) contains additional properties prefixed withCOREDUMP_. These are used bycoredumpctlto find the most recent coredumps.The output of
coredumpctlgenerates an overview over the most recent coredumps. It looks like this after running the bogus program:$ coredumpctl TIME PID UID GID SIG COREFILE EXE Mon 2021-07-19 00:26:24 CEST 3327042 1000 100 11 error /home/ma27/a.outThis indexing can also be used to list e.g. all programs that coredumped at the current boot:
$ journalctl -F COREDUMP_EXE -b 0 | sort | uniq
/home/ma27/a.out
In order to find out what really went wrong, a popular tool for these kind of investigations
is GNU’s gdb(1). With bt (for backtrace) it’s possible to look
at the callstack that lead to the crash. Additionally, it can be used to search through the
address space of the process. It’s directly integrated with coredumpctl and can be used like
this:
$ sudo coredumpctl gdb
/* output omitted */

For help, type "help".
Type "apropos word" to search for commands related to "word"...
Reading symbols from /home/ma27/a.out...
[New LWP 3327042]
Core was generated by `./a.out'.
Program terminated with signal SIGSEGV, Segmentation fault.
#0  0x0000000000401102 in main ()
In some cases, gdb(1) can tell which variables are affected from which file, in which
line, which function etc.. For such a navigation through the machine code and memory, so-called
debugging symbols are required. These debugging symbols can be included by compiling with gcc -g.
Unfortunately, that’s usually not the case for e.g. proprietary software or prebuilt binaries
in general.
However it’s always possible to look at the raw machine code (Intel x86
in this case) with gdb(1) by using the x command to eXamine the memory and code of the crashed process
since all of this information is a part of the coredump. With /5i we we obtain a disassembly of the next 5 machine instructions starting
from where the program crashed:
(gdb) x/5i $pc
=> 0x401102 <main+16>:	movl   $0x1,(%rax)
   0x401108 <main+22>:	mov    $0x0,%eax
   0x40110d <main+27>:	pop    %rbp
   0x40110e <main+28>:	ret
   0x40110f:	nop
This shows us where the error is, we’re trying to assign 1 to a pointer which points to the
(unreachable) memory address 0x0. This can be confirmed by looking at what the %rax register
points to:
(gdb) x $rax
   0x0:	Cannot access memory at address 0x0
For a full overview of memory debugging with gdb(1) I’d recommend looking at the following
summary hosted at sourceware.org.
Debug symbols for Nix packages
Even though this approach can be very powerful, it can easily become fairly time-consuming rather
quickly. The x86 instruction set is not only a so-called CISC-architecture (and thus it’s very hard to know
precisely what all operations are used for), understanding the memory layout of a complex program can
take quite some time.
Therefore it’s preferable to use debugging symbols which help gdb to tell which
part of a program has caused the crash.
The downside of this is that the size of binaries increases significantly with debugging
symbols included. In nixpkgs, multiple-output derivations are utilized to properly solve this issue: by default, a build using stdenv.mkDerivation gets all debugging symbols removed
during the fixupPhase using
strip(1).
There are two ways to retain debugging symbols:
-
Disable stripping via
dontStrip = true;in the derivation. This has the downside that the binaries are significantly larger. -
Declaring
separateDebugInfo = true;. This makes sure that an additional output calleddebugwith all necessary debugging symbols will be created.
By enabling environment.enableDebugInfo = true; in your NixOS
configuration, these debug-outputs will be installed to your system for each package
that has such an output.
Note: in order to be sure that coredumpctl actually takes this into account when streaming
a coredump to gdb(1), you have to run
$ sudo -E coredumpctl gdb
as this makes sure that your environment (with $NIX_DEBUG_INFO_DIRS) is used by gdb.
In case of the bogus C code from the first paragraph, you’d now get an even better hint
of what went wrong when opening gdb and having debug symbols available:
$ sudo -E coredumpctl gdb
/* output omitted */

[New LWP 902089]
Core was generated by `./a.out'.
Program terminated with signal SIGSEGV, Segmentation fault.
#0  0x0000000000401102 in main () at foo.c:4
4	    *ptr = 1;
This also saves us some tedious decompilation and memory inspection work.
This is of course just a small example, but it sheds a light on what debugging symbols are good for and that debugging information can be separated into their own output in order to reduce runtime closure size.
Prometheus
These tools and approaches can be fairly helpful to investigate what went wrong when a single
process crashed. But sometimes it can be helpful to know how often something breaks or even when:
if you have a large deployment there’s a certain chance that some crashes that are worth looking
into don’t get noticed. This is especially the case if the program only crashes under certain
circumstances and gets automatically restarted by systemd thanks to e.g.
Restart=always.
One popular tool to gather this kind of statistics is called Prometheus. Prometheus works by pulling statistics from different exporters from different machines and serves as central facility where you can introspect these statistics, write custom queries and define alerts for abnormal values.
Since I haven’t found any tool so far that provides metrics for this, I decided to write my own prometheus exporter for coredumps. It’s available at gitlab.com/Ma27/coredump-exporter.
The service can be configured as follows in a NixOS config:
1{
2  services.coredump-exporter.enable = true;
3}
Note: please keep in mind that you have to obtain the module from the repository itself since
this is not a part of nixpkgs (yet).
This exporter provides the following metrics:
-
coredumps_totalrepresents the total amount of coredumps on a system grouped by the kernel’s boot id. This is a UUID randomly generated for each boot. See alsosd_128_get_machine(3).This is necessary because the exporter loads - just like
coredumpctl(1)- this information from the journal which can become arbitrarily large and it’s unfortunately only possible to get all coredumps inO(n)time because every log-entry has to be checked forCOREDUMP_*fields.However, this doesn’t mean that the exporter is noticeably slow: journal-entries are indexed by their severity (for example, you can fetch errors only from your journal via
journalctl -p 2) and the exporter only searches in messages with a higher priority, since coredumps aren’t logged with the typical default-priority. -
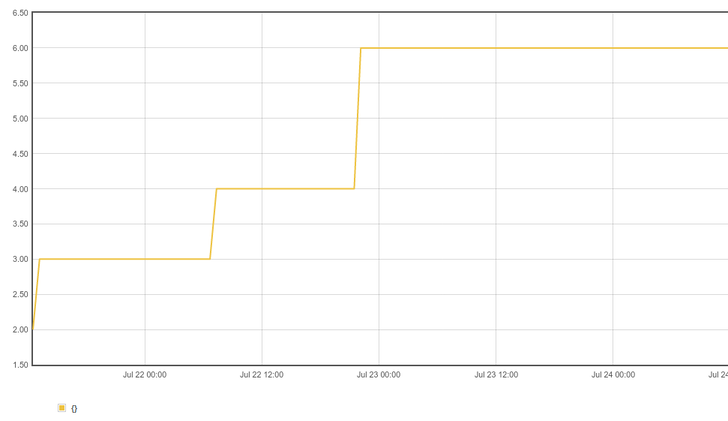
coredumpsrepresents the total amount of coredumps grouped by boot id, program that has crashed and whichsignal(7)(e.g.SIGSEGV) was sent.$ curl localhost:9113 | grep 'coredumps{' coredumps{boot_id="b3c6905f-587a-4ce4-9d4a-dcc9e3e7047e",exe="/home/ma27/a.out",signal_name="SIGSEGV"} 2.0
Of course, it may be helpful to only look for how often something has segfaulted or how often a program
coredumps (without caring about which signal was sent for instance). This can be done by using
Prometheus’s query language. The following snippet shows a query to return the amount of crashed nix-processes
that aborted with SIGABRT:
1sum(coredumps{instance="localhost:9113",signal_name="SIGABRT",exe=~".*/nix"})
Thoughts for the future
After learning about all of these tricks, I actually started to consider coredumps a helpful asset to
debug issues. Unfortunately, the debugging symbols aren’t available in many packages in nixpkgs due to
concerns about disk space (see also nixpkgs#18530).
Because of that, only the most critical packages in nixpkgs are using separateDebugInfo = true;, e.g.
glibc or openssl.
A simple workaround for this is a custom overlay which enables debugging-symbols for packages where this is needed:
 1self: super:
 2
 3let
 4  withDebugOut = drv: drv.overrideAttrs (super.lib.const {
 5    separateDebugInfo = true;
 6  });
 7in {
 8  hello = withDebugOut super.hello;
 9
10  /* and even more … */
11}
Please keep in mind that you’ll have to recompile every package that is referenced in such an overlay!
Also, this means that a lot of packages are effectively duplicated in a binary cache which builds nixpkgs
with an overlay as shown above just to get debug outputs for certain packages.
In a bright future with Nix supporting CAS one may be able to
build the package with all outputs, but only the debug output must be copied to the binary cache because
all the other outputs have the same content as the non-debug packages built on
hydra.nixos.org.
However this is all based on the assumption that separateDebugInfo doesn’t affect $out and similar paths
in any way. Perhaps it will be necessary to invest more reproducible-builds efforts into this.